
How to Solve Your Lab Woes by Troubleshooting Analytical Method Problems
Troubleshooting Analytical Method Problems Starts With Isolation
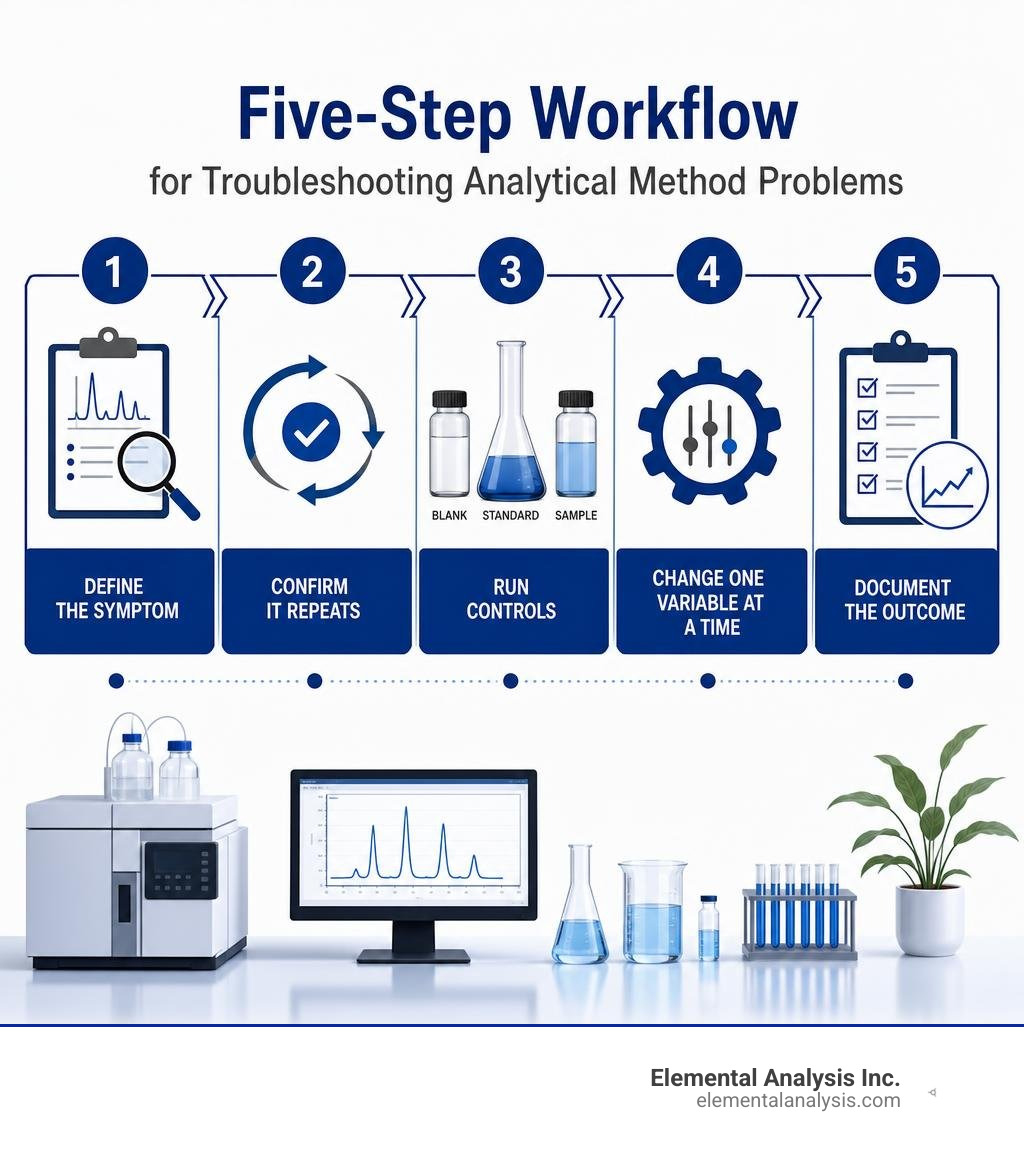
Troubleshooting analytical method problems means finding the true source of unreliable data before changing the method, replacing parts, or reporting results. Start by confirming that the problem is repeatable, then compare a blank, a known standard, and the affected sample. This quickly helps separate sample and matrix effects from mobile phase, column, instrument, or data-processing issues.
For a fast first check:
- Define the symptom: Record what changed – retention time, peak shape, baseline, pressure, response, or precision.
- Confirm it repeats: A one-off event may be a handling error. A repeatable event can be investigated.
- Run controls: Use blanks and an independent reference standard to determine whether the issue follows the sample or the system.
- Change one variable at a time: Avoid making several adjustments at once, which hides the root cause.
- Document the outcome: Compare results with normal pressure, retention, response, and system-suitability history.
Small shifts can become major quality risks in trace-element, pharmaceutical, aerospace, and environmental testing. A drifting baseline, unexpected peak, weak response, or poor precision may begin with something simple: contaminated solvent, unstable sample preparation, a blocked frit, air in a flow path, or a worn instrument component.
The good news is that most lab woes respond well to structured diagnosis. Instead of guessing, treat each unusual result as a testable question. Establish what “normal” looks like, isolate the possible sources, and keep a clear record of every observation and change.
Troubleshooting analytical method problems helpful reading:
- specialized analytical chemistry services
- induced coupled plasma
- alloy verification laboratory analysis
Systematic Strategies for Troubleshooting Analytical Method Problems
When complex chromatography or spectroscopy methods fail, it is tempting to start turning knobs, replacing guard columns, and re-making mobile phases all at once. Resist that urge! Random tinkering usually consumes valuable billable hours and often introduces brand-new variables that mask the original failure. Nearly 99% of routine HPLC and instrument operational problems can be solved or avoided entirely by abiding by four foundational principles:
- The Rule of One: Change only one parameter at a time. If you swap a column, alter the flow rate, and prepare fresh mobile phase in a single sweep, you will never know which change actually fixed the issue—or which one made it worse.
- The Rule of Two: Every anomaly must be verified as repeatable before attempting a fix. A sudden baseline spike might simply be a brief electrical disturbance or microbubble passing through the cell; if it does not repeat on a second injection, you do not need to tear down the detector.
- Put It Back: If a tentative fix (like installing a spare check valve) fails to resolve the symptom, remove the new component and reinstall the original. Otherwise, you end up with a hybrid instrument filled with semi-tested parts.
- Accurate Record Keeping: Maintain rigorous operational logs. Knowing that your system backpressure was 1,800 psi last month makes a current reading of 2,400 psi instantly meaningful.
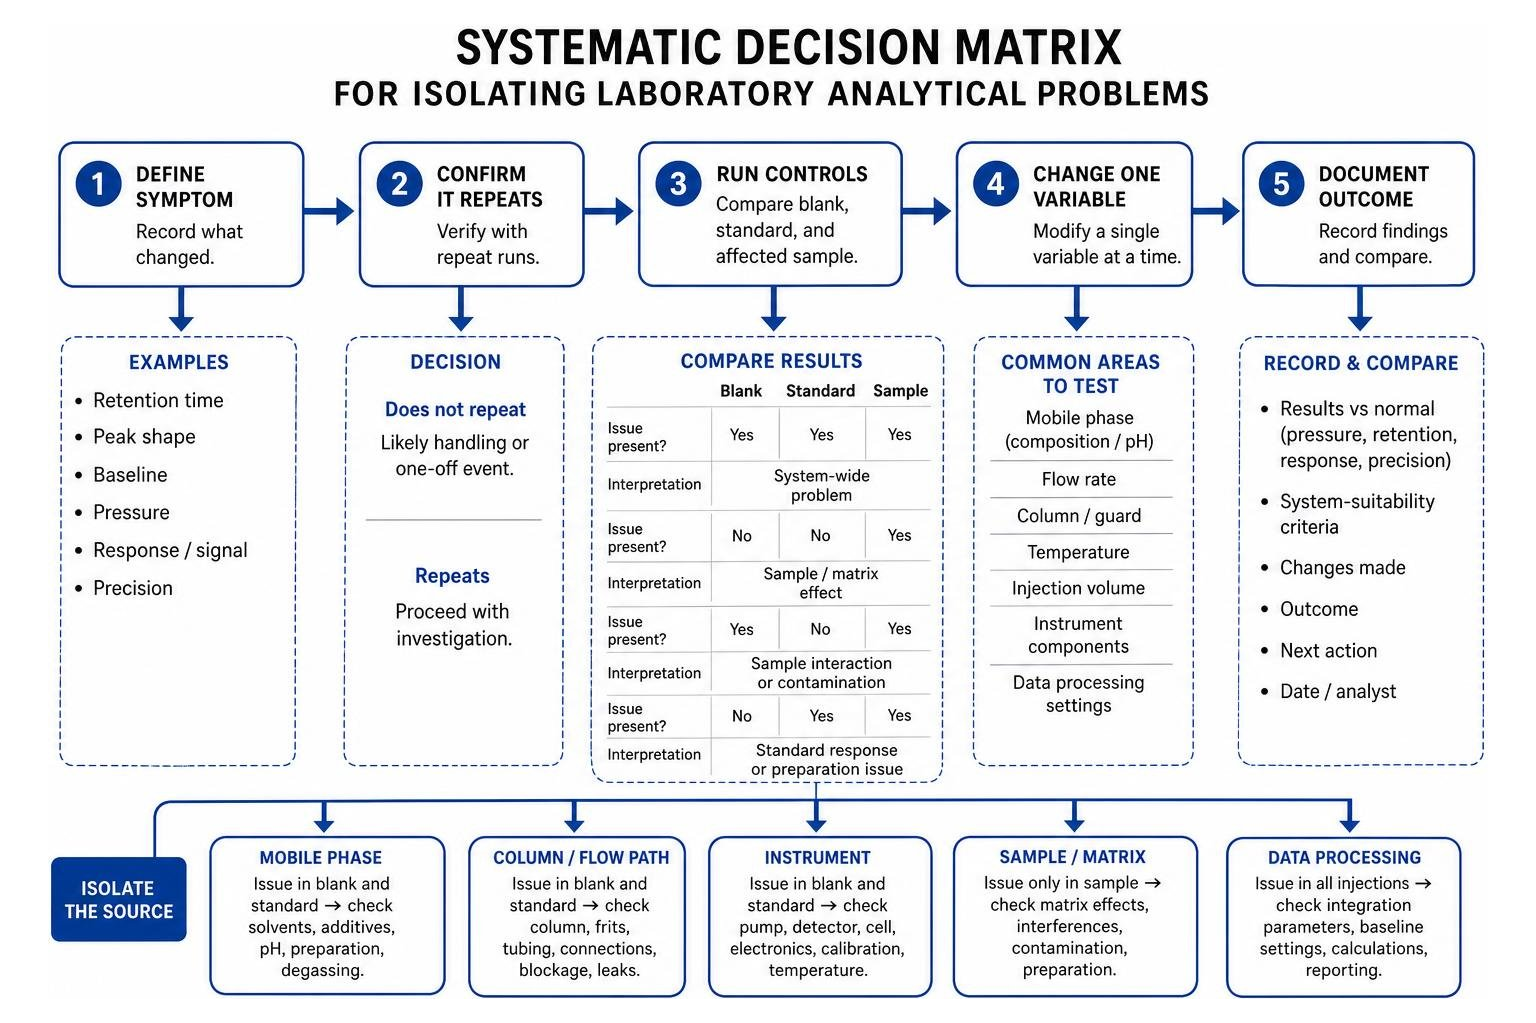
To structure your investigation when troubleshooting analytical method problems, adopt a formal Problem-Analysis Scheme. First, sit at your desk before pulling out a wrench. Write down the precise symptom, list every potential cause, note a fast test method for each hypothesis, and check off counter-indications.
When symptoms persist across multiple runs, apply formal Root Cause Analysis (RCA) techniques such as the 5 Whys or an Ishikawa (Fishbone) Diagram. For example, if you observe baseline drift, ask why until you reach the underlying cause:
- Why is the baseline drifting? Because the mobile phase composition is fluctuating.
- Why is it fluctuating? Because organic solvent is evaporating unevenly.
- Why is it evaporating? Because the reservoir cap was left unsealed overnight.
- Why was it unsealed? Because the analyst lacked a proper fitting cap with a vapor trap.
- Why was the cap missing? Because standard operating procedures for mobile phase storage were not enforced.
Formal guidance on incorporating these structured RCA tools into laboratory workflows can be reviewed in the Analytical Method Development SOP Guide.
Diagnosing Chromatographic Symptoms: Retention, Column, and Peak Issues
Chromatographic peaks tell a detailed story about the health of your mobile phase, sample, and column stationary phase. When peak symmetry or retention time degrades, the chromatogram itself serves as your primary diagnostic tool.
Troubleshooting Analytical Method Problems in Retention Time and Baseline Stability
Retention time shifts undermine compound identification and quantitative accuracy. If peaks migrate earlier or later across a run queue, begin by checking flow rate stability and thermal control. A slight ambient temperature fluctuation in a laboratory without strict climate control can shift retention times noticeably. In reversed-phase HPLC, even a 1°C temperature drop can increase retention times by 1% to 2%.
Mobile phase preparation errors represent another major source of baseline and retention variability. Always measure buffer pH in the pure aqueous fraction before adding organic modifiers like acetonitrile or methanol. Adding organic solvents alters hydrogen ion activity and yields inconsistent pH readings. Furthermore, keep your buffer concentration within the recommended 5 to 100 mM range. Buffers below 5 mM lack sufficient buffering capacity to maintain stable analyte protonation, while concentrations above 100 mM risk salt precipitation inside pump heads and tubing when mixed with high percentages of organic solvents.
Baseline problems manifest as noise, drift, or spurious “ghost peaks”:
- Cyclic baseline noise: Often traces back to pump pressure pulsations, worn piston seals, or ambient room air conditioning cycling on and off over detector cells.
- Erratic spikes: Typically caused by microbubbles escaping solution in the detector flow cell. Ensure proper vacuum degassing or apply 30–50 psi of backpressure on the detector waste line using narrow-bore restrictor tubing.
- Ghost peaks: Spurious peaks appearing during gradient runs are frequently organic contaminants accumulating in aqueous mobile phases or low-grade reagents during column re-equilibration. Always use HPLC or LC-MS grade solvents and ultra-pure 18.2 MΩ·cm water.
For comprehensive symptom-based diagnostics, consult the Effective LC Troubleshooting Guide.
Resolving Column Performance Deterioration and Peak Distortion
Column degradation is inevitable over hundreds of injections, but premature failure usually stems from avoidable mechanical or chemical stress. Common peak distortions and their solutions include:
- Peak Tailing: Occurs when basic analytes interact with un-endcapped, active silanol groups ($\text{Si-OH}$) on silica surface packing. To resolve silanol tailing, select a fully endcapped or sterically protected column, adjust the mobile phase pH to keep the analyte fully ionized or un-ionized, or increase the buffer strength to 50–100 mM.
- Peak Splitting or Shoulder Peaks: Caused by a clogged inlet frit, a physical void at the head of the column bed, or sample solvent strength mismatch (e.g., injecting a sample dissolved in 100% organic solvent into a high-aqueous mobile phase). Match your sample diluent as closely as possible to the initial mobile phase composition.
- Peak Fronting: Almost universally indicates column overloading—either injecting too much total analyte mass or exceeding recommended volume limits. Keep the injection volume below 2% of the total column void volume (e.g., $\le 20\text{ }\mu\text{L}$ on a standard $4.6 \times 150\text{ mm}$ column).
- Loss of Resolution: Caused by gradual loss of bonded stationary phase or persistent contaminant accumulation.
When column backpressure rises or peak shapes deteriorate, perform column regeneration before discarding the column. Flush reversed-phase columns with a sequence of at least 20 to 30 column volumes per solvent step: begin with warm water (to dissolve accumulated buffer salts), transition to 100% methanol, proceed to 100% acetonitrile, wash with isopropanol (to strip strongly retained lipophilic contaminants), and then re-equilibrate back to your starting mobile phase. Always bypass the detector during aggressive column flushing!
Isolating Causes: Sample, Phase, Column, or Hardware?

When an analytical run fails system suitability, you must systematically isolate the guilty component. The system fluidic pathway follows a logical progression: Mobile Phase $\rightarrow$ Pump $\rightarrow$ Injector $\rightarrow$ Column $\rightarrow$ Detector. Troubleshoot along this exact flow path.
Isolating Matrix Interactions vs Hardware Failures
Is the anomaly caused by a hardware failure or a problematic sample matrix? To find out, execute a simple isolation sequence:
- Inject a Solvent Blank: If baseline noise, ghost peaks, or pressure fluctuations disappear during a solvent blank, your instrument hardware and mobile phase are functional. The issue lies within your sample preparation or sample matrix.
- Inject a Known Reference Standard: Prepare a fresh, independent reference standard using certified reference materials (CRMs) in pure solvent. If the pure standard gives sharp, symmetrical peaks while your real-world sample produces split or tailing peaks, you are dealing with matrix interferences, co-eluting matrix components, or active site adsorption.
- Bypass System Components: To isolate backpressure blockages, disconnect fittings starting at the detector waste outlet and work backward toward the pump. If disconnecting the column inlet causes the system pressure to drop from 3,500 psi down to under 100 psi, the blockage is located directly in the column or guard frit.
- Detector Bypass Test: To distinguish fluidic baseline noise from electrical detector noise, turn off the pump flow completely and monitor the baseline for 10 minutes. If noise persists with zero flow, the problem is electronic or lamp-related; if the baseline flattens immediately, the issue is fluidic (e.g., check valve wear, bubbles, or mixing ripples).
Understanding standard protocol parameters allows you to verify whether hardware operates within published tolerances, as detailed in our guide to A Beginner Guide to Industry Standard Methods.
Furthermore, never underestimate sample transport flow path activity. Uncoated stainless steel tubing, worn autosampler needles, or corroded fittings can adsorb active compounds (such as sulfur species, proteins, or trace metals), leading to false negatives or severe response delays. Replacing worn fittings or using inert-coated flow paths eliminates non-specific surface binding.
Preventing Validation Failures and Maintaining Method Integrity
Preventing failures is always more cost-effective than investigating out-of-specification (OOS) results. Integrating key analytical validation parameters into routine testing lets you detect early signs of method deterioration before system suitability fails.
| Validation Parameter | Acceptance Criteria | Common Causes of Failure | Corrective Action |
|---|---|---|---|
| Linearity ($r^2$) | $r^2 > 0.995$ | Mass overload detector saturation; volumetric pipetting errors; sample decomposition across calibration levels. | Re-prepare fresh stock solutions; narrow calibration range; verify detector linear response limits. |
| Y-Intercept at 100% | $\le 2.0\%$ of working response | Blank contamination; improper baseline integration forcing zero point; reagent impurities. | Subtract reagent blank correctly; inspect baseline integration parameters; replace contaminated diluent solvents. |
| Accuracy (% Recovery) | $95.0\% – 105.0\%$ | Incomplete matrix extraction; analyte adsorption on container walls; matrix ion suppression/enhancement. | Use internal standard normalization; optimize extraction solvents; employ matrix-matched standards. |
| Precision (%RSD) | $\%RSD \le 2.0\%$ | Pump flow pulsation; autosampler needle leaks; temperature fluctuations; partial sample evaporation in vials. | Replace pump piston seals; inspect needle wash seals; thermostat column/autosampler compartments. |
For a deeper look into statistical evaluation and lower detection limits, review our In-Depth Guide to Low Detection Limits.
Preventing Documentation Gaps when Troubleshooting Analytical Method Problems
Regulatory audits frequently uncover compliance failures stemming from poor documentation during method troubleshooting rather than hardware issues. Under ICH Q2(R1) guidelines, every analytical adjustment must be fully traceable. Common compliance traps include:
- Missing Confidence Intervals: Reporting mean accuracy recovery or precision without specifying 95% confidence intervals or standard deviations.
- Insufficient Data Points: Evaluating linearity with fewer than 5 concentration levels, or assessing repeatability with fewer than 6 replicate injections at 100% working concentration.
- Undocumented System Suitability Test (SST) Failures: Aborting a run queue after an SST failure without documenting the root cause in the instrument logbook. In regulated environments, an SST failure must be logged alongside the corrective action taken.
- Ignoring Instrument Drift: Failing to account for signal drift during long analytical queues. To mitigate drift, intersperse calibration standards and blanks regularly throughout your sample sequence—ideally every 10 samples.
To maintain routine performance, stick to a strict preventive maintenance schedule:
- Daily: Log baseline backpressure, verify mobile phase volume, check waste containers, and flush buffer salts out of fluid pathways using pure deionized water before system shutdown.
- Quarterly: Replace pump piston seals, check valve cartridges, and inline filter frits.
- Biannually / Annually: Replace deuterium detector lamps when energy output drops below 80% of initial intensity, inspect autosampler rotor seals, and qualify column compartment oven calibration.
Frequently Asked Questions
What are the most common causes of retention time shifts in HPLC and GC?
Retention shifts stem primarily from temperature variation, mobile phase composition changes, and flow rate instability. In HPLC, subtle mobile phase evaporation alters organic ratio strength; a 1% shift in acetonitrile content can noticeably shift retention times. In GC, carrier gas leakages, altered column head pressure, or phase degradation from oxygen exposure at elevated temperatures are the usual culprits.
How can I distinguish between sample matrix issues and column degradation?
Inject a freshly prepared certified reference standard in pure solvent. If the pure standard exhibits symmetrical peak shapes, stable retention, and expected theoretical plate counts, your column is healthy—the issue originates from sample matrix interferences or incomplete extraction. If the pure standard yields tailing, split peaks, or reduced resolution, the column stationary phase is fouled or degraded.
How often should preventive maintenance be performed on analytical systems?
Log operational parameters (backpressure, noise, drift) daily. Perform routine hardware servicing quarterly by replacing high-wear components like pump seals, check valves, and autosampler needle wash seals. Inspect detector lamps monthly and replace them annually (or after 1,000–2,000 hours of operation). Always perform system re-qualification following major hardware maintenance.
Conclusion
Mastering troubleshooting analytical method problems transforms frustrating laboratory delays into structured, solvable scientific questions. By abandoning trial-and-error guessing in favor of systematic rules—isolating variables one at a time, verifying repeatability, inspecting peak symmetry, and maintaining meticulous daily records—you protect both data integrity and project timelines.
When complex matrices, tight detection limits, or persistent analytical anomalies strain your internal lab capacity, expert external support makes all the difference. At Elemental Analysis Inc. (located in Lexington, KY), we specialize in trace element identification, quantification, and speciation. As the nation’s premier commercial PIXE (Particle-Induced X-ray Emission) laboratory, we deliver fast turnaround and competitive pricing across non-destructive and destructive testing methods.
Whether you need to resolve tough analytical interferences or require trusted third-party validation, explore our comprehensive ICP Analysis Services or contact our chemistry team today to streamline your laboratory operations!