
How to Characterize Nanomaterials Without Losing Your Mind
Why Nanomaterial Characterization Determines Whether Your Research Stands or Falls
Nanomaterial characterization is the process of measuring the physical, chemical, and structural properties of particles at the nanoscale — typically below 100 nm — to understand how they behave and whether they are safe and effective for their intended use.
If you need a quick answer, here are the core properties you must measure:
| Property | Why It Matters | Common Technique(s) |
|---|---|---|
| Particle size | Controls reactivity, toxicity, and regulatory classification | TEM, DLS, SAXS, XRD |
| Size distribution | Reveals batch consistency and agglomeration | DLS, TEM, SAXS |
| Shape / morphology | Affects surface area, optical, and biological behavior | TEM, SEM, AFM |
| Crystal structure | Confirms phase identity and purity | XRD, EXAFS, electron diffraction |
| Surface chemistry | Determines ligand binding, reactivity, and stability | XPS, FTIR, TGA, NMR |
| Surface charge (zeta potential) | Predicts colloidal stability in suspension | Zeta potential analyzer |
| Elemental composition | Identifies impurities and stoichiometry | ICP-MS, EDX, XPS |
| Aggregation/dispersion state | Affects real-world dosing and toxicology | DLS, TEM, NTA |
Here is the problem: nanomaterials are not just small versions of bulk materials. A 10 nm iron oxide particle behaves completely differently from a 50 nm one — and neither behaves like the bulk material at all. Their enormous surface-to-volume ratio means that surface atoms dominate every property, from catalytic activity to how the immune system responds.
That makes characterization both critical and genuinely difficult.
Unlike conventional chemical analysis, you cannot rely on a single measurement. A technique that works perfectly for one property — say, XRD for crystal structure — can be nearly useless for the same particle when it drops below 3 nm or lacks long-range order. As a result, most reliable characterization workflows require multiple complementary techniques, each filling the gaps left by the others.
And there is no universal standard yet. As of June 2026, no fully standardized protocols exist for most nanomaterial characterization workflows, and certified reference materials (CRMs) are still limited primarily to particle size — leaving surface chemistry, particle number concentration, and complex-matrix measurements largely unvalidated.
This guide breaks down which techniques measure what, when to combine them, and how to avoid the most common pitfalls — without needing a PhD in metrology to follow along.
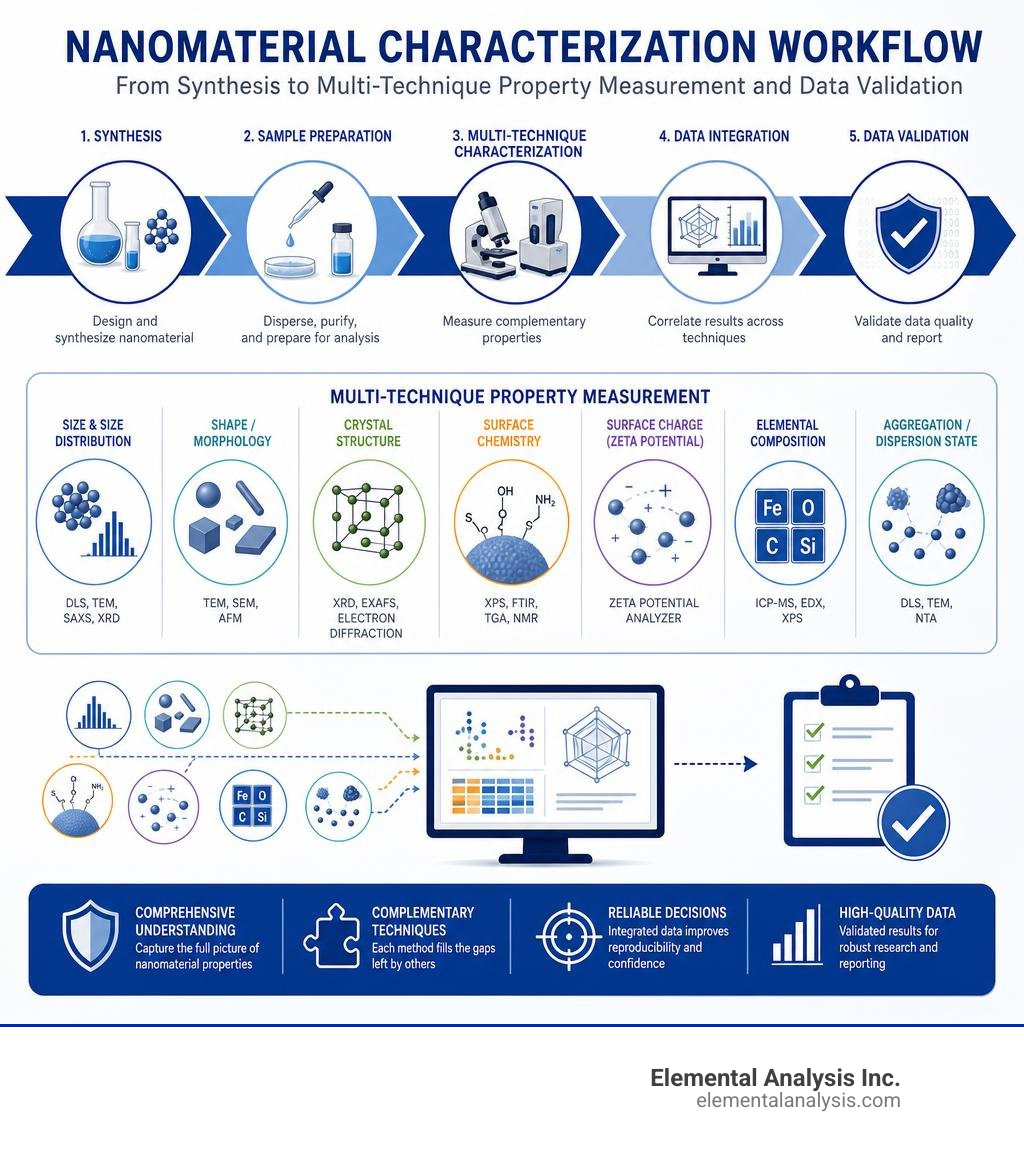
Critical Nanoparticle Properties to Measure
To design a predictable, reproducible nanomaterial, we must look beyond basic chemical composition. Two particles can share the exact same chemical formula yet exhibit completely different toxicological profiles, optical properties, and catalytic behaviors due to differences in physical structure.
Sizing and Morphology: Beyond the 100 nm Boundary
When we talk about nanoparticle size, we are actually talking about several different metrics.
- Core Size: The physical boundary of the inorganic or solid core of the nanoparticle.
- Hydrodynamic Diameter: The effective size of the particle as it diffuses through a liquid, which includes the core, any surface ligands, and the surrounding solvation shell (the layer of solvent molecules that travel with the particle).
This distinction is why different techniques yield different values. Transmission Electron Microscopy (TEM) measures the dry core size with high spatial resolution, typically achieving sizing accuracy within 3% of the actual value. Conversely, Dynamic Light Scattering (DLS) measures the hydrodynamic diameter in suspension. If your nanoparticles are coated with a stabilizing polymer like polyvinylpyrrolidone (PVP), DLS will report a significantly larger size than TEM because it sees the extended polymer chains and the water molecules dragged along with them.
For a deeper dive into how these physical principles govern nanomaterial behavior, the Handbook of Materials Characterization | Springer Nature Link serves as an invaluable structural reference.
Surface Chemistry and Charge in Nanomaterial Characterization
Because nanoparticles have an exceptionally high surface-to-volume ratio, their surface chemistry dictates how they interact with their environment. Understanding this behavior requires measuring:
- Ligand Density and Binding: The concentration and attachment mode of surface molecules (ligands) that prevent aggregation.
- Oxidation States: The chemical state of surface atoms, which can differ dramatically from the core. X-ray Photoelectron Spectroscopy (XPS) is highly effective here, probing the top 1 to 10 nm of the surface to map chemical states and core-shell architectures.
- Zeta Potential (Electrokinetic Potential): The electrical charge at the boundary of the particle’s sliding plane in a liquid.
Zeta potential serves as a key predictor of colloidal stability. If your particles have a low charge, they will eventually collide and fuse. We generally evaluate stability using these thresholds:
- 0 to ±5 mV: Highly unstable; particles will rapidly agglomerate.
- ±5 to ±20 mV: Minimally stable.
- ±20 to ±40 mV: Moderately stable.
- ±40 mV and above: Highly stable; strong electrostatic repulsion keeps the particles suspended.
These properties directly impact the dispersion state of your sample. It is vital to distinguish between agglomerates (weakly bound, reversible clusters held together by van der Waals forces) and aggregates (irreversibly fused particles).
Furthermore, surface area measurements must be interpreted carefully. While Brunauer-Emmett-Teller (BET) gas adsorption is the standard for measuring specific surface area, dry-state measurements do not always reflect liquid-phase behavior. For instance, BET surface area measurements for magnetite ($Fe3O4$) nanoparticles have been reported as high as 286.9 m² g⁻¹. While this indicates exceptional porosity, severe drying-induced agglomeration can easily clog active pore sites, leading to measured surface areas that deviate wildly from theoretical values.
The Nanomaterial Characterization Toolbox: Techniques and Trade-offs
No single instrument can provide a complete picture of a nanomaterial. Selecting the right workflow requires balancing the strengths, limitations, and resolution limits of multiple complementary methods.
| Technique | Primary Properties Measured | Strengths | Major Limitations | Volume vs. Local |
|---|---|---|---|---|
| XRD | Crystallite size, crystal phase, lattice parameters | Statistically representative; no vacuum required; non-destructive | Broadens to the point of uselessness for particles <3 nm; requires crystalline materials | Volume-averaged |
| TEM | Core size, morphology, aggregation state, local structure | Direct imaging with sub-nanometer resolution; shape visualization | High cost; vacuum-sensitive; extensive sample prep can introduce drying artifacts | Highly localized |
| SAXS | Particle size, shape distribution, core-shell structure | Measures in-situ liquid state; statistically robust | Requires high-intensity sources (often synchrotrons) for weak scatterers | Volume-averaged |
| XPS | Surface elemental composition, oxidation states, ligand binding | Extreme surface sensitivity (~1–10 nm depth); quantitative | Requires ultra-high vacuum (UHV); dry samples only | Volume-averaged (surface) |
| EXAFS | Interatomic distances, coordination numbers, local geometry | Element-selective; works on amorphous materials and ultra-small particles (<3 nm) | Requires synchrotron radiation; complex data modeling | Local coordinate-averaged |
By combining these techniques, you can cross-verify your data. For example, using XRD to get a volume-averaged crystallite size, TEM to verify individual particle shapes, and SAXS to measure the size distribution in liquid suspension ensures that your conclusions are not biased by sample preparation artifacts.
X-Ray Diffraction (XRD) vs. Extended X-Ray Absorption Fine Structure (EXAFS)
When analyzing crystal structures, researchers often turn first to powder X-ray Diffraction (XRD). Using the Scherrer equation, we can estimate average crystallite size from peak broadening. However, XRD relies on long-range crystalline order. When particles are smaller than 3 nm, or if they are amorphous, the diffraction peaks become so broad that they merge into the background, rendering the data uninterpretable.
This is where Extended X-Ray Absorption Fine Structure (EXAFS) becomes essential. Unlike XRD, EXAFS is element-selective and does not require long-range crystalline order. It probes the local coordination environment of specific absorbing atoms, providing precise interatomic distances and coordination numbers.
For instance, in ultra-small germanium or cadmium sulfide (CdS) nanoparticles, EXAFS can resolve the exact bond distances (such as the Cd-S first-neighbor distance) even when the particles are too small or disordered to produce clear XRD peaks. For a complete guide on implementing these structural characterization tools, consult Characterization Techniques for Nanomaterials – 1st Edition – Imalka M.
Microscopy vs. Scattering: TEM, SEM, and SAXS
Choosing between direct imaging (TEM/SEM) and scattering (SAXS) is a classic trade-off between local detail and statistical representation.

TEM provides unmatched spatial resolution, allowing you to visually confirm shell thicknesses in core-shell structures or identify non-spherical shapes (like nanostars or nanorods). However, preparing a TEM grid requires drying your sample under vacuum, which can cause artificial aggregation. Furthermore, because you only image a tiny fraction of your sample, TEM sizing can suffer from operator bias if you selectively image “nice-looking” fields of view.
Small-Angle X-ray Scattering (SAXS) solves this by measuring millions of particles simultaneously in their native liquid environment. Because SAXS measures the entire sample volume, it yields highly accurate, statistically representative size distributions.
However, SAXS is an indirect method; you must fit the scattering data to a mathematical model (e.g., assuming spherical or core-shell geometries). If your sample contains a mixture of unknown shapes, the modeling becomes highly complex. Combining the two — using TEM to identify the shape and SAXS to quantify the size distribution — provides the most reliable data.
Overcoming the Limits of Traditional Characterization
Standard analytical techniques often struggle when applied to complex nanostructures, such as particles smaller than 3 nm, thick organic ligand shells, or particles embedded in complex biological matrices.
Characterizing Ultra-Small Nanoparticles (Below 3 nm)
Ultra-small nanoparticles (often called nanoclusters) occupy the transition zone between molecules and bulk materials. In this regime:
- XRD peaks are too broad to resolve.
- Conventional TEM suffers from poor contrast against the carbon support membrane.
To resolve these structures, we use aberration-corrected Scanning Transmission Electron Microscopy (STEM), which achieves sub-nanometer resolution and can image individual heavy atoms.
Additionally, EXAFS provides critical data by determining the average coordination number of the atoms. If the coordination number drops significantly below the bulk value, it confirms that a large fraction of the atoms reside on the particle surface, pointing to an ultra-small core size.
Resolving Ligand Shells and Surface Coatings
The organic stabilizer shell that keeps nanoparticles from clumping is invisible to standard electron microscopy and XRD. To characterize these coatings, we rely on specialized techniques:
- TGA-MS (Thermogravimetric Analysis – Mass Spectrometry): By heating the sample and analyzing the evolved gases, TGA-MS can detect ligand decomposition events at nanogram sensitivity, allowing you to calculate the exact mass fraction and surface coverage of ligands on gold or silica nanoparticles.
- NMR DOSY (Diffusion Ordered Spectroscopy): This non-destructive technique measures the diffusion coefficients of molecules in solution. It can determine the hydrodynamic radii of noble metal nanoparticles (typically 1–5 nm) by tracking how the attached ligands move, offering an elegant, liquid-phase alternative to TEM sizing.
- SANS (Small-Angle Neutron Scattering): Neutrons scatter differently than X-rays and are highly sensitive to light elements like hydrogen. By utilizing deuterium contrast matching, combined SAXS/SANS approaches can simultaneously resolve the inorganic core size (via SAXS) and the organic stabilizer distribution (via SANS) in complex systems like polymer-coated zinc oxide (ZnO) nanoparticles.
Emerging Techniques for Real-Time and Surface Analysis
To transition from static, dry-state measurements to active, real-time tracking, researchers are increasingly adopting advanced, specialized characterization workflows.
Liquid TEM and GISAXS for In Situ Dynamics
Traditional electron microscopy requires a high vacuum, which historically limited our ability to study nanoparticles in liquid.

Liquid Cell TEM overcomes this limitation by sandwiching the liquid sample between two ultra-thin, electron-transparent membranes (usually silicon nitride or graphene). This setup allows researchers to image real-time dynamics, such as:
- Nanoparticle growth kinetics and crystal nucleation.
- Self-assembly pathways of nanoparticle arrays.
- Real-time structural degradation or etching processes.
For thin films and surface-bound nanoparticles, GISAXS (Grazing-Incidence Small-Angle X-ray Scattering) provides a non-destructive way to measure nanoparticle shape, size, and spatial arrangement over large surface areas, making it highly valuable for semiconductor and sensor manufacturing.
Advanced Surface Analysis: HS-LEIS and TGA-MS
When your nanoparticle’s performance relies entirely on its outermost layer of atoms, conventional surface techniques like XPS (which integrates over a 1–10 nm depth) may not be precise enough.
HS-LEIS (High-Sensitivity Low-Energy Ion Scattering) provides true top-atomic-layer sensitivity. By bouncing low-energy noble gas ions off the sample surface, HS-LEIS identifies only the atoms on the absolute outer surface. This technique has been used to measure the thickness of self-assembled monolayers (SAMs) on 14 nm gold nanoparticles with sub-nanometer depth sensitivity, yielding values that align closely with AFM and X-ray reflectivity measurements.
Metrology, Standardization, and Reproducibility Challenges
The lack of reproducibility in nanotechnology is a well-known issue. Minor changes in sample preparation, dilution, or storage can dramatically alter the measured properties of a nanomaterial.
The Lack of Certified Reference Materials (CRMs)
A primary barrier to standardizing nanomaterial characterization is the shortage of Certified Reference Materials (CRMs).
A true CRM must have metrological traceability to SI units and a fully defined uncertainty budget. Because nanoparticles are thermodynamically unstable, they degrade, oxidize, or aggregate over time, giving nanoscale CRMs much shorter shelf lives than conventional chemical standards.
Currently, available CRMs (such as those from NIST or the European Commission’s Joint Research Centre) focus almost exclusively on particle size (e.g., monodisperse gold or silica spheres). There is a critical shortage of reference materials certified for:
- Surface chemistry and ligand density.
- Particle number concentration.
- Behavior in complex, application-relevant matrices (like blood, soil, or food).
The current limitations and future needs of this metrological hierarchy are detailed in Nanoscale reference and test materials for the validation of characterization methods for engineered nanomaterials — current state, limitations, and needs – PMC.
Standardizing Protocols for Nanomaterial Characterization
To minimize sample preparation artifacts and ensure reproducible measurements, laboratories should establish strict Standard Operating Procedures (SOPs):
- Control the Dispersion State: Always report the solvent, pH, ionic strength, and temperature of your liquid suspension. A change in pH can shift the zeta potential, causing a stable suspension to aggregate and altering your DLS sizing results.
- Standardize Sonication Energy: When dispersing dry powders into liquids, the duration and energy of sonication must be controlled. Insufficient sonication fails to break up agglomerates, while excessive sonication can strip surface ligands or damage fragile nanostructures.
- Report Multiple Sizing Metrics: Avoid reporting a single average size. Always provide both number-weighted distributions (which highlight smaller particles) and intensity-weighted distributions (which are highly sensitive to larger aggregates).
Frequently Asked Questions about Nanoparticle Analysis
Why does DLS show a larger particle size than TEM?
DLS measures the hydrodynamic diameter, which includes the inorganic core, surface-bound ligands, and the surrounding layer of solvent molecules that move with the particle. TEM images the dry, high-contrast inorganic core under vacuum. Additionally, DLS is an intensity-weighted technique; because light scattering is proportional to the sixth power of the particle diameter ($I \propto d^6$), even a tiny fraction of large dust particles or aggregates will bias the DLS average toward a larger size.
When should I use EXAFS instead of XRD?
You should use EXAFS when your nanoparticles are smaller than 3 nm, amorphous (lacking long-range crystalline order), or embedded in a complex matrix at low concentrations. Because EXAFS is element-selective and probes only short-range coordination (the immediate atomic neighbors), it provides accurate bond distances and coordination numbers where XRD fails due to extreme peak broadening.
How does zeta potential predict colloidal stability?
Zeta potential measures the electrostatic charge at the boundary of the particle’s hydration shell. A high absolute zeta potential (greater than +30 mV or less than -30 mV) indicates strong electrostatic repulsion between neighboring particles, which prevents them from colliding and aggregating. If the zeta potential approaches zero, the repulsive forces vanish, allowing van der Waals forces to pull the particles together into large, irreversible aggregates.
Conclusion: Partnering with Elemental Analysis Inc.
Navigating the complexities of nanomaterial characterization requires more than just high-end instrumentation — it demands deep analytical expertise and rigorous quality control. At Elemental Analysis Inc., based in Lexington, KY, Kentucky USA, we help simplify this process.
As the first commercial Proton Induced X-ray Emission (PIXE) laboratory, we offer a specialized suite of non-destructive and destructive testing services. Whether you require precise trace element identification, quantification, or detailed chemical speciation, we deliver highly reliable data with fast turnaround times and competitive pricing.
Ready to streamline your analytical workflow and get definitive answers about your samples? Explore our Elemental Analysis NAA Services today to see how we can support your research.